# theta = (mu, omega, alpha, beta); returns r in percent
sig2_path <- function(th, r) {                 # the variance recursion
  e <- r - th[1]; s2 <- numeric(length(r)); s2[1] <- var(r)   # start value
  for (t in 2:length(r)) s2[t] <- th[2] + th[3] * e[t-1]^2 + th[4] * s2[t-1]
  s2
}
ell <- function(th, r) {                       # the vector of l_t(theta)
  s2 <- sig2_path(th, r); -0.5 * log(s2) - (r - th[1])^2 / (2 * s2)
}
nll <- function(th, r) {                       # minus the quasi-log-likelihood
  if (th[2] <= 0 || th[3] < 0 || th[4] < 0 || th[3] + th[4] >= 1) return(1e10)
  -sum(ell(th, r))
}Time Series Econometrics
Lecture 15: Volatility — ARCH and GARCH
Samir Orujov, PhD
Open lecture notes, after Stanislav Anatolyev’s course (2016)
🎬 The Idea in 3 Minutes
⬅ Previous lecture: 14 · Vector Autoregressions, Impulse Responses and Cointegration
A short film with the intuition. Watch it before the slides, or after. Captions: CC button.
🎯 Learning Objectives
By the end of this lecture, you will be able to:
- Write the GARCH(1,1) model and derive its unconditional variance, persistence and kurtosis
- Estimate a GARCH(1,1) by Gaussian (quasi-)maximum likelihood with
optim() - Explain why QMLE needs Bollerslev–Wooldridge standard errors
- Test for ARCH effects with the \(TR^2\) Lagrange multiplier statistic
- Recognise the multivariate (BEKK, CCC, DCC), jump and stochastic-volatility extensions
🔁 Warm-up from last time
In a bivariate VAR for \((\Delta m_t, \Delta p_t)\), what does “\(\Delta m\) does not Granger-cause \(\Delta p\)” mean?
- All coefficients on lagged \(\Delta m\) in the \(\Delta p\) equation are zero
- The impulse response of \(\Delta p\) to a money shock is zero at impact
- Money and prices are not cointegrated
- The share of money shocks in the variance decomposition of \(\Delta p\) is 50%
🗺️ Where We Are
Lecture 14 modelled the conditional mean of a vector: \(E(x_t \mid I_{t-1})\) in a VAR, its impulse responses and its variance decomposition.
Lecture 1 gave a warning we have not yet used. A series can be stationary with a constant unconditional variance while its conditional variance moves over time.
Today the object of interest is that conditional variance, \[\sigma_t^2 = \operatorname{var}(r_t \mid I_{t-1}),\] for a single return series \(r_t\).
❓ The Question
How risky is tomorrow?
A risk desk holds an S&P 500 index position. On a calm day the index moves by about half a percent; in March 2020 it moved by 5–12% a day for weeks.
Returns are nearly unpredictable in mean, so the conditional mean is of little use. Their size is predictable: a large move today makes a large move tomorrow more likely. Margins, Value-at-Risk and option prices all need a forecast of that size.
📈 Volatility Clusters
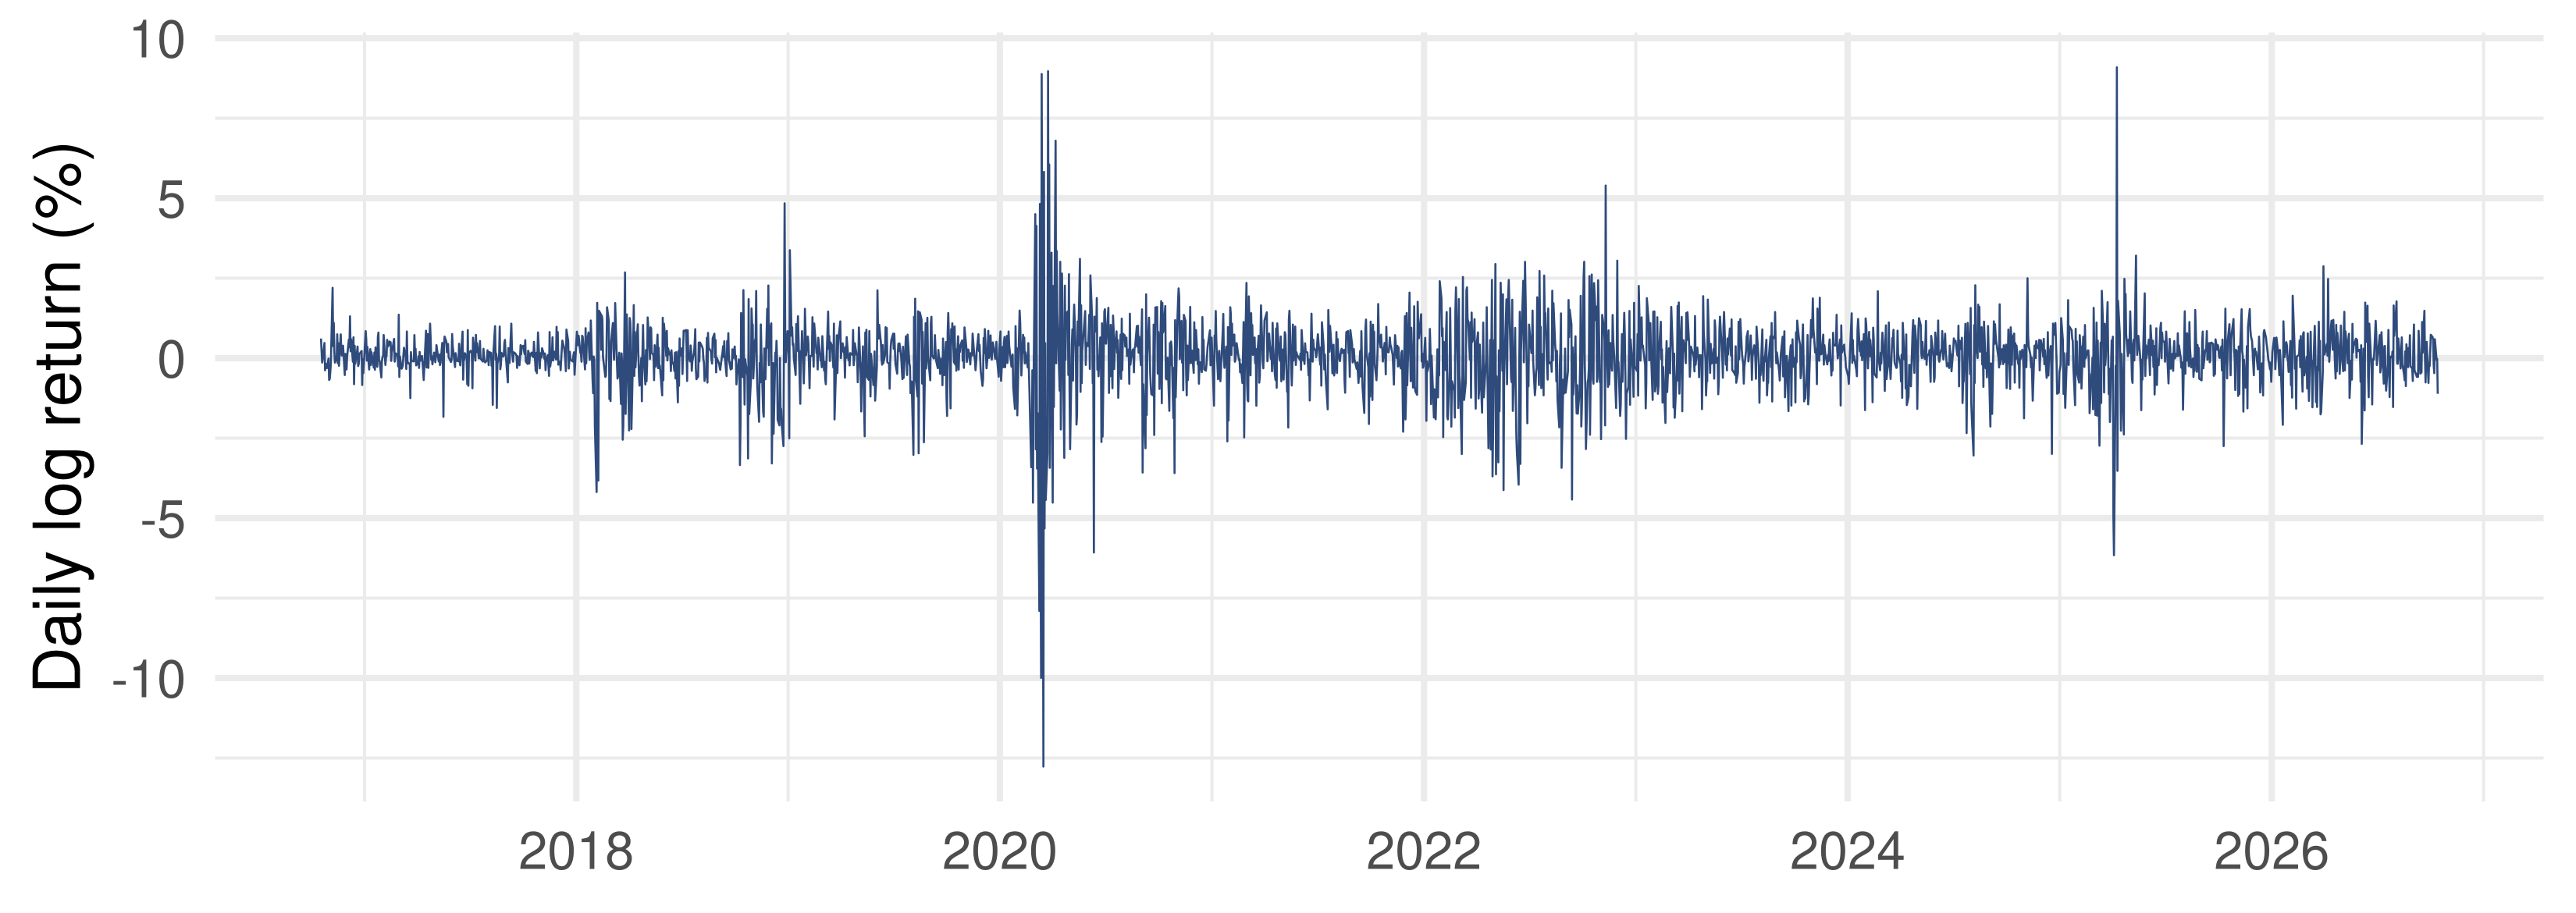
S&P 500, October 2016 – October 2026. Quiet stretches alternate with turbulent ones: large moves of either sign come in clusters.
📐 The GARCH(1,1) Model
GARCH(1,1) (Bollerslev, 1986)
\[r_t = \mu_t + \varepsilon_t, \qquad \varepsilon_t = \sigma_t \eta_t, \qquad \eta_t \sim \text{iid } \mathcal N(0,1),\] \[\sigma_t^2 = \omega + \alpha\,\varepsilon_{t-1}^2 + \beta\,\sigma_{t-1}^2, \qquad \omega > 0,\ \alpha \ge 0,\ \beta \ge 0.\]
- \(\mu_t = E(r_t \mid I_{t-1})\) is the conditional mean: a constant, or an AR term
- \(\sigma_t^2\) is known at \(t-1\): it is the conditional variance of \(r_t\)
- \(\alpha\) is the reaction to yesterday’s news \(\varepsilon_{t-1}^2\); \(\beta\) is the memory of yesterday’s variance
- \(\beta = 0\) gives Engle’s (1982) ARCH(1); ARCH(\(q\)) has \(\sigma_t^2 = \omega + \alpha_1\varepsilon_{t-1}^2 + \dots + \alpha_q\varepsilon_{t-q}^2\)
📐 A Predictive Model: AR-ARCH-M
Lecture 3 used this as the example of a non-structural model, built for fit and forecasting rather than derived from an optimising agent: \[r_t = c + \rho\, r_{t-1} + \delta\,\sigma_t^2 + \varepsilon_t, \qquad \varepsilon_t \mid I_{t-1} \sim (0, \sigma_t^2), \qquad \sigma_t^2 = \omega + \alpha\,\varepsilon_{t-1}^2 .\]
- The variance enters the mean (“in mean”, M): \(\delta\) is the price of risk
- \(\delta > 0\) says investors demand a higher expected return when conditional risk is higher
- Mean and variance must now be estimated jointly; a wrong variance equation also biases \(\hat c\), \(\hat\rho\), \(\hat\delta\)
📐 Properties: Unconditional Variance
Take expectations of the variance equation. Since \(E\varepsilon_{t-1}^2 = E\big[E(\varepsilon_{t-1}^2 \mid I_{t-2})\big] = E\sigma_{t-1}^2\), under stationarity \(E\sigma_t^2 = \bar\sigma^2\) for all \(t\): \[\bar\sigma^2 = \omega + \alpha\bar\sigma^2 + \beta\bar\sigma^2 \quad\Longrightarrow\quad \bar\sigma^2 = \operatorname{var}(\varepsilon_t) = \frac{\omega}{1-\alpha-\beta}.\]
- A finite, positive solution needs \(\alpha + \beta < 1\): this is the condition for covariance stationarity
- \(\varepsilon_t\) is then weak white noise, indeed an MDS: uncorrelated, constant variance \(\bar\sigma^2\), yet not independent
- With \(\alpha + \beta = 1\) (IGARCH) the unconditional variance is infinite
Not in the 2016 notes: added from Bollerslev (1986) and Tsay (2010), ch. 3.
📐 Properties: Persistence and Half-Life
Write \(v_t = \varepsilon_t^2 - \sigma_t^2\), an MDS. Then GARCH(1,1) is an ARMA(1,1) in \(\varepsilon_t^2\): \[\varepsilon_t^2 = \omega + (\alpha+\beta)\,\varepsilon_{t-1}^2 + v_t - \beta\, v_{t-1}.\]
Iterating the variance equation forward gives the \(h\)-step forecast \[\sigma_{t+h \mid t}^2 = \bar\sigma^2 + (\alpha+\beta)^{h-1}\big(\sigma_{t+1}^2 - \bar\sigma^2\big).\]
- \(\alpha + \beta\) is the persistence: the rate at which a variance shock decays
- Half-life: \((\alpha+\beta)^h = \tfrac12\), so \(h_{1/2} = \ln 0.5 / \ln(\alpha+\beta)\)
Not in the 2016 notes: added from Bollerslev (1986) and Tsay (2010), ch. 3.
📐 Properties: Fat Tails
With \(\eta_t \sim \mathcal N(0,1)\), \(E\varepsilon_t^4 = 3E\sigma_t^4 \ge 3(E\sigma_t^2)^2\) by Jensen. A random variance mixes normals, and the mixture has fatter tails. For GARCH(1,1) the kurtosis is \[\kappa = \frac{E\varepsilon_t^4}{(E\varepsilon_t^2)^2} = \frac{3\big[1-(\alpha+\beta)^2\big]}{1-(\alpha+\beta)^2-2\alpha^2} > 3,\] finite only if \((\alpha+\beta)^2 + 2\alpha^2 < 1\). For ARCH(1): \(\kappa = 3(1-\alpha^2)/(1-3\alpha^2)\), finite if \(\alpha^2 < 1/3\).
Volatility clustering and fat tails are one phenomenon, not two.
Not in the 2016 notes: added from Bollerslev (1986) and Tsay (2010), ch. 3.
✏️ Worked Example: A GARCH Forecast
Daily returns in %: \(\omega = 0.02\), \(\alpha = 0.08\), \(\beta = 0.90\). Today \(\sigma_t^2 = 1.5\) and the shock was \(\varepsilon_t = -3\).
1. Long-run level. \(\bar\sigma^2 = 0.02/(1-0.98) = 1\): daily sd 1%, annualised \(1\% \times \sqrt{252} = 15.9\%\).
2. Tomorrow. \(\sigma_{t+1}^2 = 0.02 + 0.08 \cdot 9 + 0.90 \cdot 1.5 = 2.09\): daily sd 1.45%.
3. Ten days ahead. \(\sigma_{t+10 \mid t}^2 = 1 + 0.98^{9}(2.09 - 1) = 1 + 0.834 \cdot 1.09 = 1.91\).
4. Half-life \(= \ln 0.5/\ln 0.98 = 34.3\) days. Kurtosis \(= 3(1-0.9604)/(1-0.9604-0.0128) = 0.1188/0.0268 = 4.43\).
📐 Estimation: Gaussian MLE
With \(\theta = (\text{parameters of } \mu_t,\ \omega,\ \alpha,\ \beta)\) and, up to a constant, \[\ell_t(\theta) = -\tfrac12 \log\sigma_t^2 - \frac{(r_t-\mu_t)^2}{2\sigma_t^2},\] \[\hat\theta = \arg\max_\theta \sum_{t=1}^T \ell_t(\theta) \quad \text{s.t.} \quad \sigma_t^2 = \omega + \alpha\varepsilon_{t-1}^2 + \beta\sigma_{t-1}^2 .\]
- \(\sigma_t^2\) is computed recursively, so it needs a start value \(\sigma_1^2\): \(\ \omega/(1-\alpha-\beta)\), or the sample variance \(\frac1T\sum(r_t-\bar r)^2\), or an extra parameter
- Restrictions \(\omega > 0\), \(\alpha, \beta \ge 0\) keep every \(\sigma_t^2\) positive
📐 Asymptotics of the MLE
If the model, including normality of \(\eta_t\), is correct: \[\hat\theta \xrightarrow{p} \theta, \qquad \sqrt T(\hat\theta-\theta) \xrightarrow{d} \mathcal N\big(0,\ I^{-1}\big),\] \[I = E\!\left[\frac{\partial \ell_t}{\partial\theta}\frac{\partial \ell_t}{\partial\theta'}\right] = -E\!\left[\frac{\partial^2 \ell_t}{\partial\theta\,\partial\theta'}\right].\]
The second equality is the information matrix equality. It holds because the likelihood is the true density. It is the first thing to fail when the density is wrong.
📐 When \(\eta_t\) Is Not Normal
- A known family. If \(\eta_t \sim \text{iid } \mathcal D(0,1,\varphi)\), e.g. a Student-\(t\) normalised to mean 0 and variance 1, then \(\varphi\) joins \(\theta\) and \(\ell_t = \log f_{\mathcal D}\). Run MLE based on \(\mathcal D\).
- ARCD (autoregressive conditional density): let the shape parameters \(\varphi\) themselves move over time.
- Nothing specified. Keep the Gaussian likelihood anyway: this is quasi-MLE (QMLE). The optimisation is the same; the asymptotics change.
If the distribution is wrong, a non-Gaussian MLE (say Student-\(t\) when the truth is not \(t\)) is in general inconsistent. The Gaussian QMLE stays consistent provided the conditional mean and variance are correctly specified.
📐 QMLE: The Sandwich
Gaussian QMLE (Bollerslev & Wooldridge, 1992)
\[\hat\theta \xrightarrow{p} \theta, \qquad \sqrt T(\hat\theta-\theta) \xrightarrow{d} \mathcal N\big(0,\ J^{-1} I J^{-1}\big),\] \[J = -E\!\left[\frac{\partial^2 \ell_t}{\partial\theta\,\partial\theta'}\right], \qquad I = E\!\left[\frac{\partial \ell_t}{\partial\theta}\frac{\partial \ell_t}{\partial\theta'}\right].\]
- Under non-normal \(\eta_t\), \(I \neq J\), so \(J^{-1}\) alone is the wrong variance
- Bollerslev–Wooldridge robust standard errors: estimate \(J\) by the average Hessian and \(I\) by the average outer product of the scores, both at \(\hat\theta\)
💻 The Quasi-Likelihood in R
The restrictions enter as a wall: outside the parameter space the objective is \(10^{10}\), so optim() never steps there. The start value is the sample variance.
💻 Does It Recover the Truth?
📦 qmle(): optim(), then Hessian and Bollerslev–Wooldridge errors; a simulated test
qmle <- function(r, start = c(mean(r), 0.05, 0.10, 0.85)) {
  f  <- optim(start, nll, r = r, control = list(maxit = 5000, reltol = 1e-12))
  f  <- optim(f$par, nll, r = r, method = "BFGS", control = list(reltol = 1e-12))
  th <- f$par
  H  <- optimHess(th, nll, r = r)                       # numerical T * J-hat
  S  <- sapply(1:4, function(k) { h <- rep(0, 4); h[k] <- 1e-5
          (ell(th + h, r) - ell(th - h, r)) / 2e-5 })    # T x 4 numerical scores
  Hi <- solve(H)
  out <- list(theta = th, se_hess = sqrt(diag(Hi)),
              se_bw = sqrt(diag(Hi %*% crossprod(S) %*% Hi)))
  lapply(out, setNames, c("mu", "omega", "alpha", "beta"))
}
set.seed(2026)
n <- 3000; th0 <- c(0.05, 0.05, 0.10, 0.85)
eta <- rt(n, df = 5) / sqrt(5 / 3)            # Student-t(5), scaled to variance 1
r_sim <- numeric(n); s2 <- th0[2] / (1 - th0[3] - th0[4]); e_prev <- 0
for (t in 1:n) {
  s2 <- th0[2] + th0[3] * e_prev^2 + th0[4] * s2
  e_prev <- sqrt(s2) * eta[t]; r_sim[t] <- th0[1] + e_prev
}
fit_sim <- qmle(r_sim)
round(rbind(truth = th0, estimate = fit_sim$theta,
            se_Hessian = fit_sim$se_hess, se_BW = fit_sim$se_bw), 4)
mu omega alpha beta
truth 0.0500 0.0500 0.1000 0.8500
estimate 0.0578 0.0476 0.0977 0.8440
se_Hessian 0.0145 0.0084 0.0125 0.0186
se_BW 0.0147 0.0122 0.0173 0.0247The shocks are Student-\(t\), so this is QMLE. The estimates sit near the truth; the robust (BW) errors on \(\omega, \alpha, \beta\) exceed the inverse-Hessian ones by a third to a half. Both use numerical derivatives.
🧪 Testing for ARCH Effects
In ARCH(\(q\)), \(\sigma_t^2 = \omega + \alpha_1\varepsilon_{t-1}^2 + \dots + \alpha_q\varepsilon_{t-q}^2\) with \(\alpha_i \ge 0\), test \[H_0:\ \alpha_1 = \dots = \alpha_q = 0 .\]
All other tests in GARCH models are standard; this one is not. Under \(H_0\) the parameters sit on the boundary \(\alpha_i = 0\), and in a GARCH alternative \(\beta\) is not even identified.
Engle’s LM test
Regress \(\hat\varepsilon_t^2\) on a constant and \(\hat\varepsilon_{t-1}^2, \dots, \hat\varepsilon_{t-q}^2\) (\(\hat\varepsilon_t\): OLS residuals of the mean equation). Then \[LM = T R^2 \xrightarrow[H_0]{d} \chi^2_q .\]
Only the model under \(H_0\) is estimated, so the boundary does no harm.
🧠 Think-Pair-Share
A colleague fits a GARCH(1,1) to daily returns in % and reports \[\hat\omega = 0.03, \qquad \hat\alpha = 0.15, \qquad \hat\beta = 0.83 .\]
- What is the half-life of a volatility shock?
- What annualised volatility does the model revert to?
- Does the fitted model have a finite fourth moment?
✅ Think-Pair-Share: Solution
Persistence \(\hat\alpha + \hat\beta = 0.98\), so \(h_{1/2} = \ln 0.5/\ln 0.98 = 34.3\) trading days, about seven weeks.
\(\bar\sigma^2 = 0.03/0.02 = 1.5\), a daily sd of \(1.22\%\), annualised \(1.22\sqrt{252} = 19.4\%\).
\((\hat\alpha+\hat\beta)^2 + 2\hat\alpha^2 = 0.9604 + 0.045 = 1.005 > 1\). No: the fourth moment is infinite.
Same persistence as the worked example, but a larger \(\alpha\): a twice as violent reaction to news. That alone is enough to destroy the fourth moment, and with it the usual interpretation of a sample kurtosis.
🎛️ Explore: \(\alpha\), \(\beta\) and Clustering
Code
viewof alpha = {
  const input = Inputs.range([0, 0.4], {value: 0.10, step: 0.01, label: "α (news)"});
  ['pointerdown','touchstart','mousedown','click','wheel','pointermove','touchmove']
    .forEach(e => input.addEventListener(e, ev => ev.stopPropagation()));
  return input;
}
viewof beta = {
  const input = Inputs.range([0, 0.95], {value: 0.88, step: 0.01, label: "β (memory)"});
  ['pointerdown','touchstart','mousedown','click','wheel','pointermove','touchmove']
    .forEach(e => input.addEventListener(e, ev => ev.stopPropagation()));
  return input;
}
Code
shocks = {
  let s = 20261;
  const u = () => (s = (s * 1103515245 + 12345) % 2147483648) / 2147483648;
  return Array.from({length: 1000}, () =>
    Math.sqrt(-2 * Math.log(Math.max(u(), 1e-12))) * Math.cos(2 * Math.PI * u()));
}
path = {
  const p = alpha + beta, omega = p < 1 ? 1 - p : 0.01;   // long-run variance 1 when p < 1
  let s2 = 1, e = 0; const out = [];
  for (let t = 0; t < shocks.length; t++) {
    s2 = omega + alpha * e * e + beta * s2;
    e = Math.sqrt(s2) * shocks[t];
    out.push({t: t + 1, r: e, sd: Math.sqrt(s2)});
  }
  return out;
}
Code
Plot.plot({
  width: 1100, height: 300, marginLeft: 70, marginBottom: 50,
  style: {fontSize: "18px"},
  x: {label: "day"}, y: {label: "return", grid: true},
  marks: [
    Plot.ruleY([0]),
    Plot.lineY(path, {x: "t", y: "r", stroke: "#8ba3c7", strokeWidth: 1}),
    Plot.lineY(path, {x: "t", y: d => 2 * d.sd, stroke: "#8b2635", strokeWidth: 2}),
    Plot.lineY(path, {x: "t", y: d => -2 * d.sd, stroke: "#8b2635", strokeWidth: 2})
  ]
})🌐 Multivariate GARCH: VECH and BEKK
For \(m\) assets, \(r_t = \varepsilon_t \mid I_{t-1} \sim (0, \Omega_t)\) with \(\Omega_t\) an \(m\times m\) conditional covariance matrix.
VECH. With \(\operatorname{vech}\) stacking the elements on and below the diagonal: \[\operatorname{vech}(\Omega_t) = \operatorname{vech}(\Sigma) + A\operatorname{vech}(\varepsilon_{t-1}\varepsilon_{t-1}') + B\operatorname{vech}(\Omega_{t-1}),\] \(A, B\) of size \(\tfrac{m(m+1)}{2}\times\tfrac{m(m+1)}{2}\). Too many parameters, and \(\Omega_t\) need not be positive definite.
BEKK (Baba, Engle, Kraft, Kroner): \[\Omega_t = \Sigma + A\,\varepsilon_{t-1}\varepsilon_{t-1}'A' + B\,\Omega_{t-1}B', \qquad A, B \ \ m\times m .\] More parsimonious, and positive definite by construction when \(\Sigma\) is.
🌐 Multivariate GARCH: CCC and DCC
CCC (constant conditional correlations, Bollerslev 1990): \[\Omega_t = C_t R\, C_t, \qquad C_t = \operatorname{diag}(\sigma_{1t}, \dots, \sigma_{mt}), \qquad \sigma_{it}^2 = \omega_i + \alpha_i\varepsilon_{i,t-1}^2 + \beta_i\sigma_{i,t-1}^2,\] with \(R\) a constant correlation matrix. Each asset gets its own GARCH.
DCC (dynamic conditional correlations, Engle 2002). In real data correlations are not constant, so let \(R_t\) move: \[\Omega_t = C_t R_t C_t, \qquad (R_t)_{ij} = \frac{q_{ijt}}{\sqrt{q_{iit}\,q_{jjt}}},\] \[q_{ijt} = \bar q_{ij}(1-\alpha-\beta) + \alpha\, z_{i,t-1}z_{j,t-1} + \beta\, q_{ij,t-1}, \qquad z_{it} = \varepsilon_{it}/\sigma_{it},\] with one pair \((\alpha, \beta)\) common to all \(i, j\).
⚡ ARCH with Jumps; Stochastic Volatility
ARCH with jumps. Within a day the price sometimes jumps. For daily returns, \[r_t = \mu + \varepsilon_t + \sum_{j=1}^{N_t} g_{jt}, \qquad \varepsilon_t \sim \text{GARCH}(1,1), \qquad g_{jt} \sim \text{iid } \mathcal N(\theta, \delta^2),\] with \(N_t \sim \text{Poisson}(\lambda_t)\) jumps on day \(t\); the intensity \(\lambda_t\) follows ARMA-type dynamics.
Stochastic volatility. \[\varepsilon_t = \sigma_t\eta_t, \qquad \log\sigma_t^2 = \omega + \beta\log\sigma_{t-1}^2 + v_t, \qquad v_t \sim \text{iid } \mathcal N(0, \sigma_v^2) \perp \eta_t .\] The variance has its own shock \(v_t\), which makes SV more flexible than GARCH. The price: \(\sigma_t^2\) is latent, so the likelihood has no closed form and needs filtering or simulation.
💰 Case Study: S&P 500 Volatility
📈 The question
A risk desk wants a daily volatility model for the index.
- Are there ARCH effects at all?
- How persistent is volatility, and where does it revert to?
- Do robust and Hessian standard errors differ?
📊 The data
Series: S&P 500 close, FRED SP500
Period: 18 Oct 2016 – 14 Oct 2026, 2,511 trading days
Transformation: \(r_t = 100\,\Delta\log P_t\), daily log returns in %; \(\mu_t = \mu\) constant
💰 Case Study: QMLE and the LM Test
📦 Fit GARCH(1,1) by Gaussian QMLE; ARCH-LM with q = 5
r <- r_all; n_r <- length(r)
e2 <- (r - mean(r))^2; X <- embed(e2, 6)                 # e2_t and 5 lags
LM <- nrow(X) * summary(lm(X[, 1] ~ X[, -1]))$r.squared
fit <- qmle(r); th <- fit$theta; p <- unname(th[3] + th[4])
z <- (r - th[1]) / sqrt(sig2_path(th, r))
kurt <- function(x) mean((x - mean(x))^4) / mean((x - mean(x))^2)^2
list(ARCH_LM = signif(c(LM = LM, p_value = pchisq(LM, 5, lower.tail = FALSE)), 3),
     estimates = round(rbind(theta = th, se_Hessian = fit$se_hess,
                             se_BW = fit$se_bw), 4),
     implied = round(c(persistence = p, half_life_days = log(0.5) / log(p),
                       annual_vol = unname(sqrt(252 * th[2] / (1 - p))),
                       kurt_r = kurt(r), kurt_eta_hat = kurt(z)), 3))
$ARCH_LM
LM p_value
7.68e+02 9.59e-164
$estimates
mu omega alpha beta
theta 0.0854 0.0340 0.1603 0.8131
se_Hessian 0.0147 0.0058 0.0184 0.0188
se_BW 0.0150 0.0101 0.0271 0.0287
$implied
persistence half_life_days annual_vol kurt_r kurt_eta_hat
0.973 25.662 17.924 19.753 5.530 Look at \(LM\), the persistence, and the two rows of standard errors.
💰 Case Study: Fitted Volatility
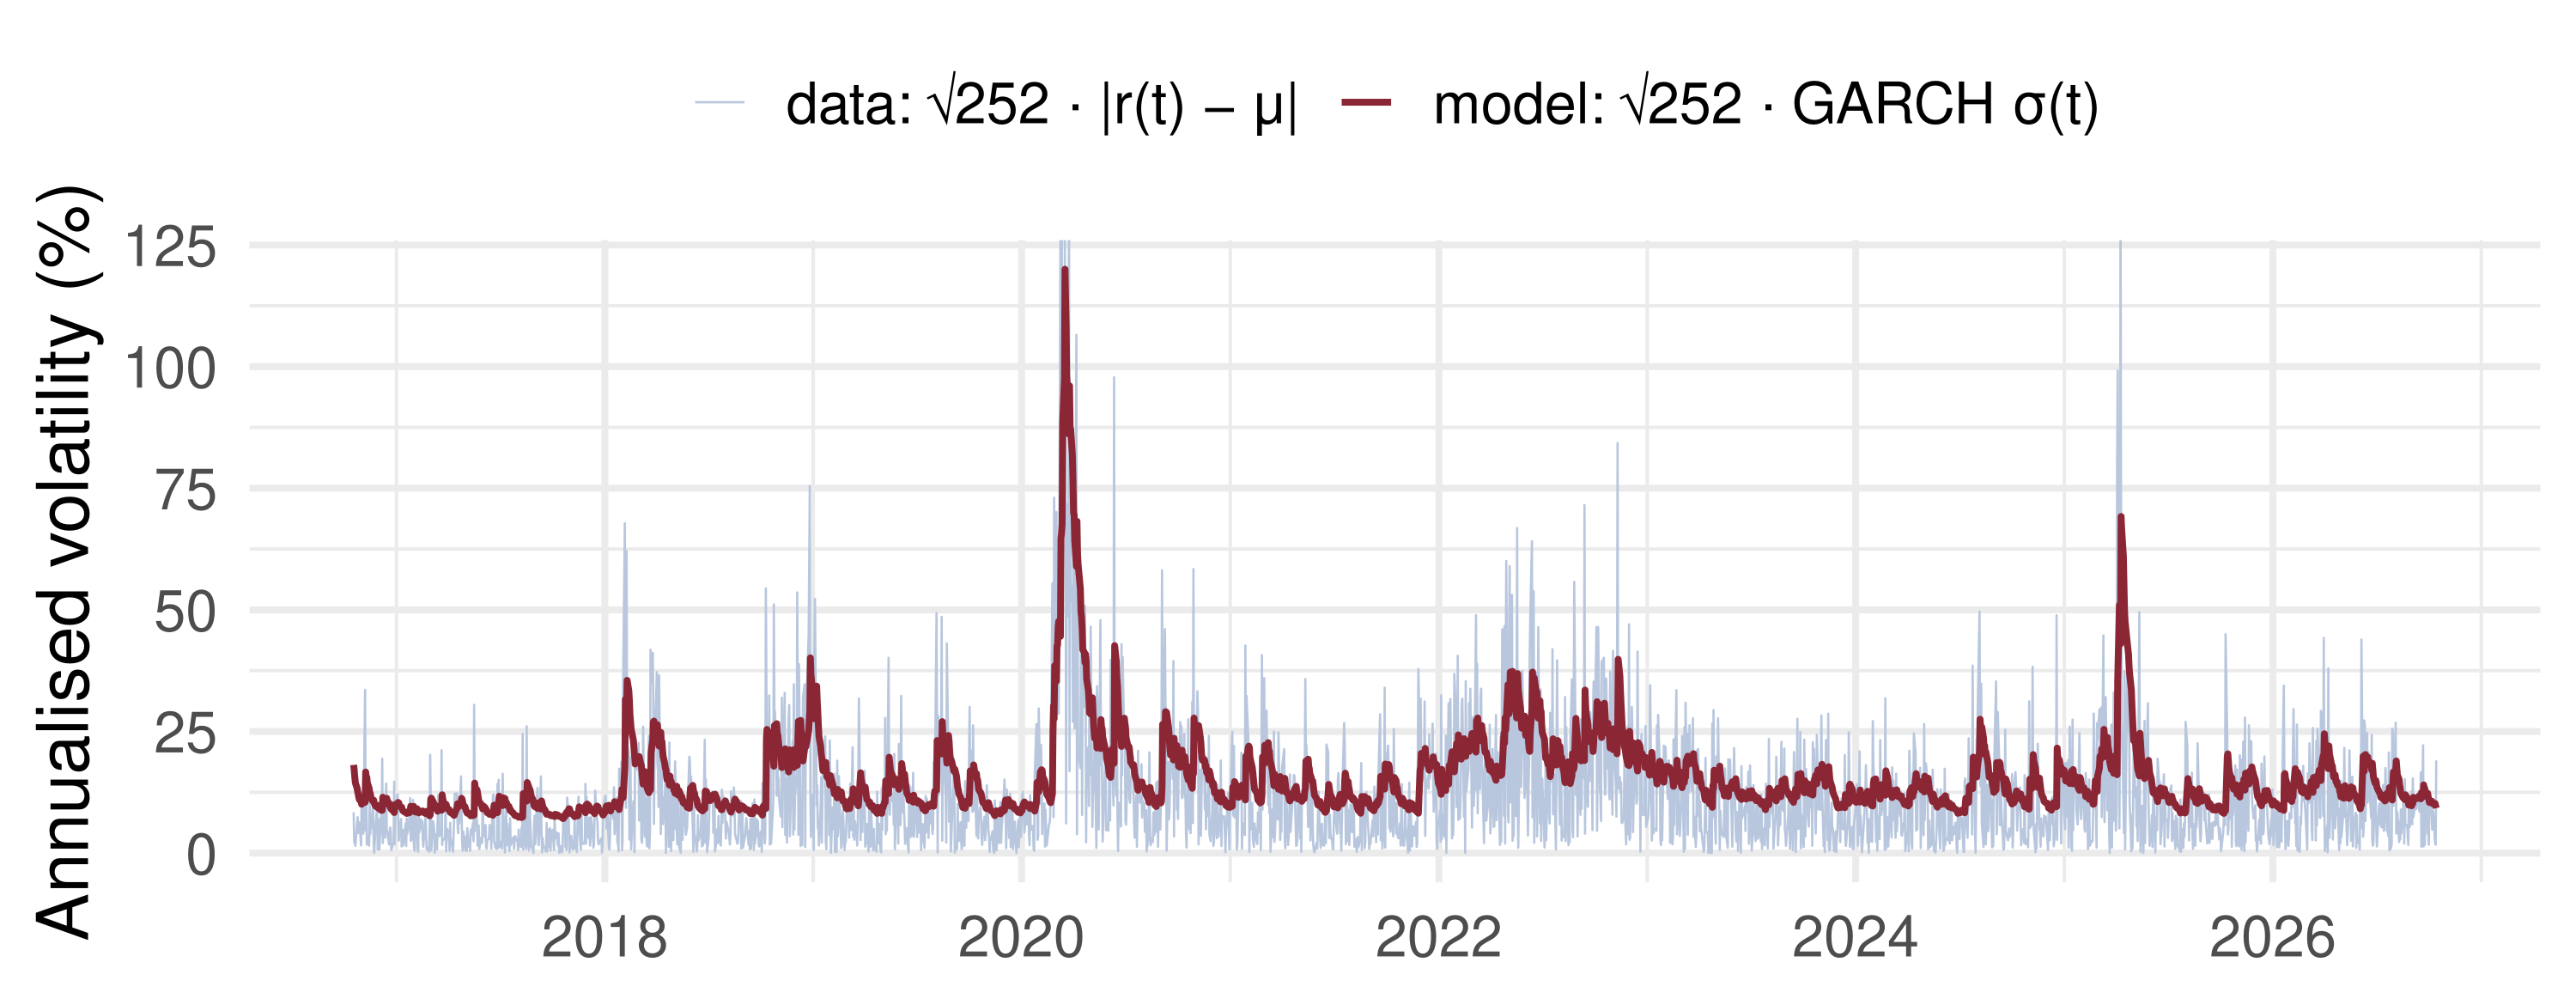
What the data say: the LM test rejects no ARCH emphatically, and \(\hat\alpha + \hat\beta \approx 0.97\): volatility shocks halve in about a month, and \(\sigma_t\) tracks every cluster. The model does not remove the fat tails: the standardised residuals still have kurtosis near 5.5, not 3, which is why the robust errors on \(\omega, \alpha, \beta\) run 50–75% above the Hessian ones.
📉 The News-Impact Curve
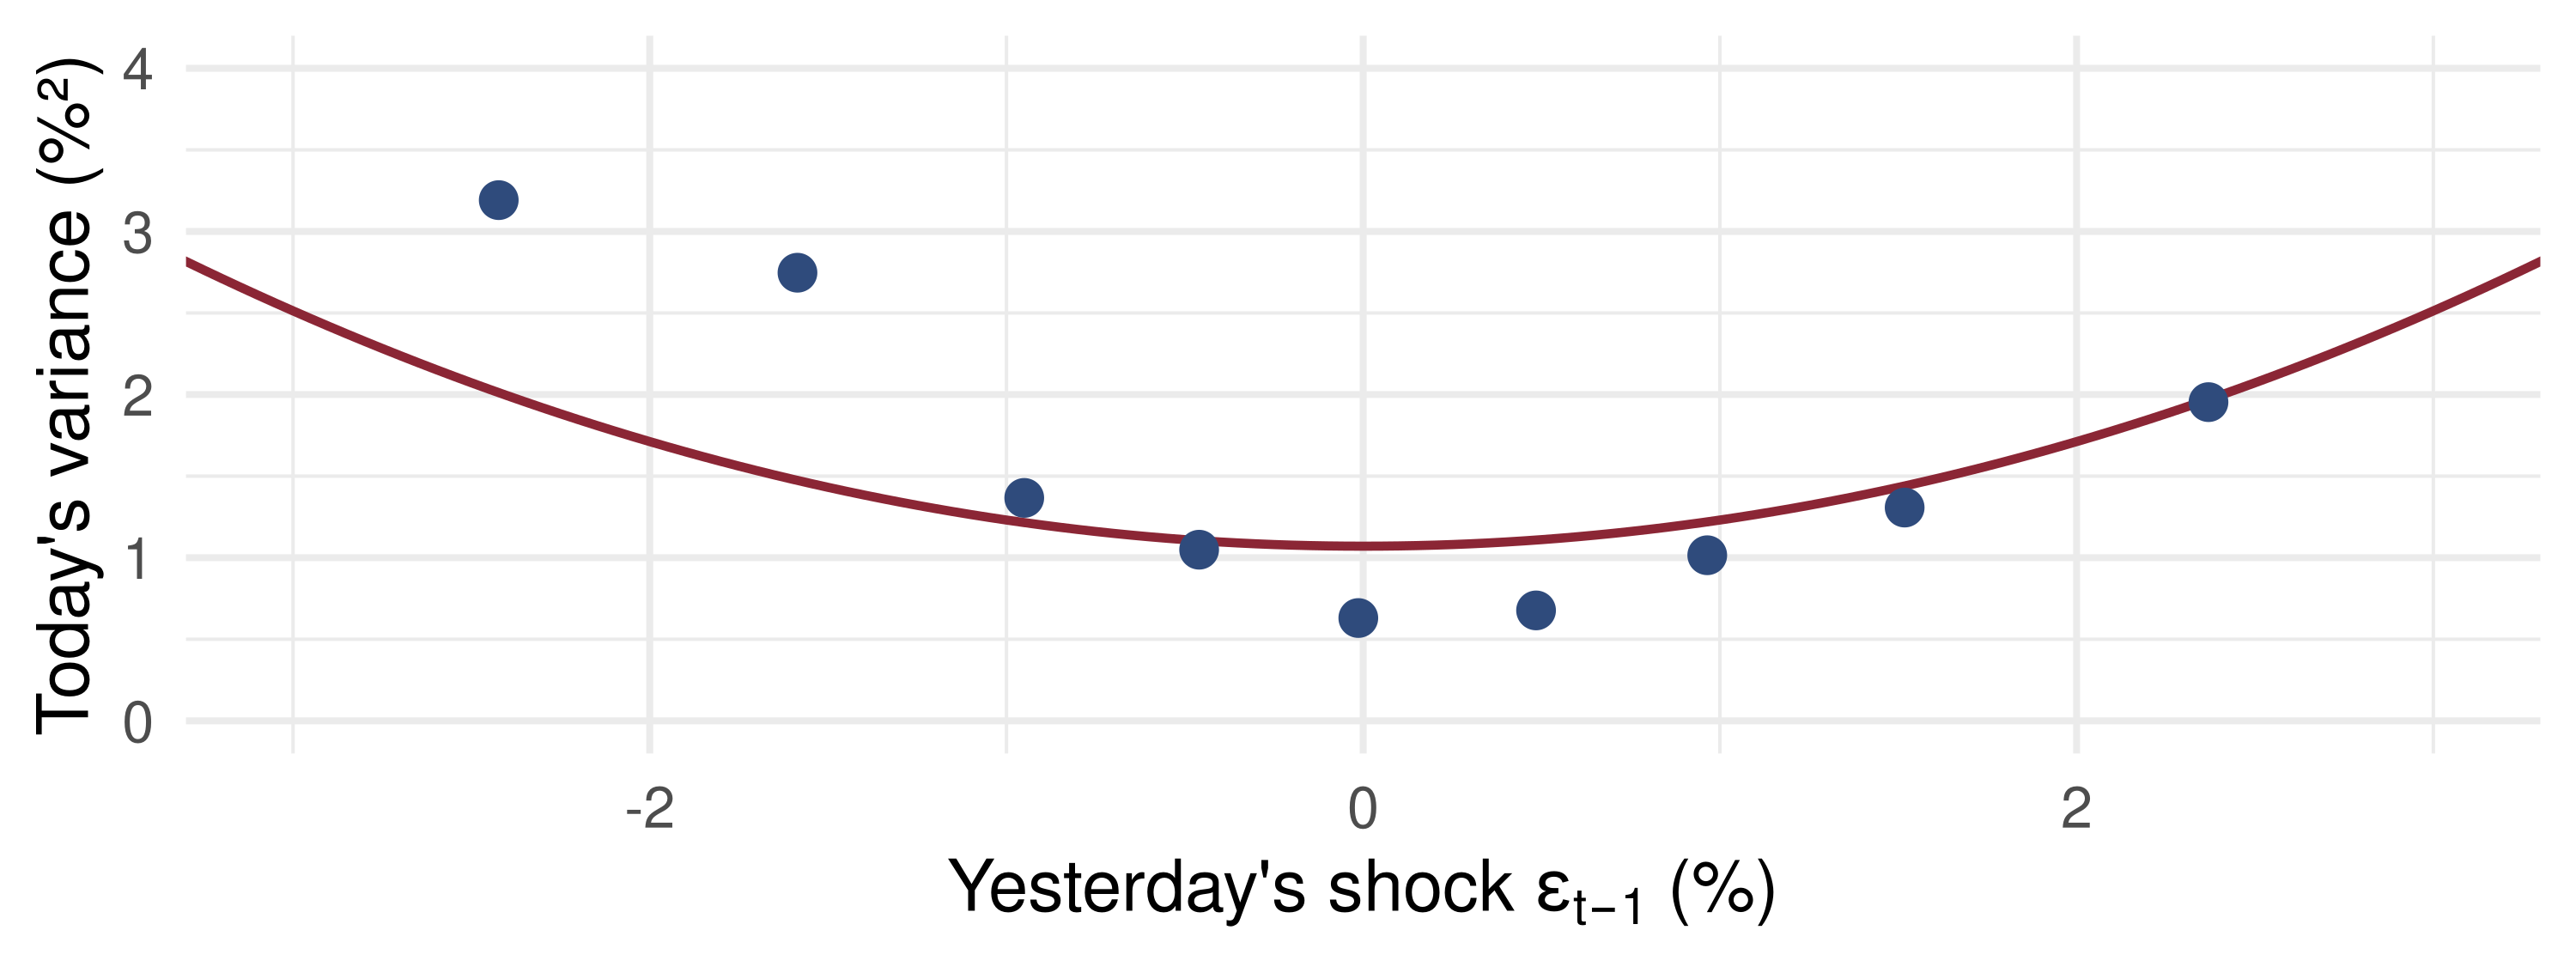
Red: \(\sigma_t^2 = \hat\omega + \hat\alpha\varepsilon_{t-1}^2 + \hat\beta\bar\sigma^2\), a parabola symmetric in the news. Blue: average realised \(\varepsilon_t^2\) in bins of \(\varepsilon_{t-1}\), symmetric about 0. Falls are followed by more volatility than rises of equal size (the leverage effect), which a symmetric GARCH cannot produce.
📝 Quiz #1: Stationarity
A GARCH(1,1) has \(\omega = 0.04\), \(\alpha = 0.06\), \(\beta = 0.90\). What is the unconditional variance of \(\varepsilon_t\)?
- \(1.0\)
- \(0.04\)
- \(0.4\)
- It does not exist, since \(\beta\) is close to 1
📝 Quiz #2: Robust Errors
You estimate a GARCH by the Gaussian likelihood, but the standardised residuals have kurtosis 5. What should you report?
- The estimates as they are, with sandwich \(J^{-1}IJ^{-1}\) (Bollerslev–Wooldridge) standard errors
- The inverse-Hessian standard errors, since the MLE is efficient
- Nothing: the estimates are inconsistent and must be discarded
- Standard errors from a Student-\(t\) likelihood fitted to the same estimates
📝 Quiz #3: The ARCH-LM Test
With \(T = 1000\) and \(q = 4\), the regression of \(\hat\varepsilon_t^2\) on four of its lags has \(R^2 = 0.012\). At 5% (\(\chi^2_4\) critical value 9.49):
- \(LM = 12 > 9.49\): reject “no ARCH effects”
- \(LM = 0.012\): do not reject
- \(LM = 3\): do not reject
- The test is invalid, because \(\alpha_i = 0\) lies on the boundary
📋 Key Formulas
| GARCH(1,1) | \(\sigma_t^2 = \omega + \alpha\varepsilon_{t-1}^2 + \beta\sigma_{t-1}^2\), \(\ \varepsilon_t = \sigma_t\eta_t\) |
| Unconditional variance | \(\bar\sigma^2 = \omega/(1-\alpha-\beta)\), needs \(\alpha+\beta<1\) |
| Forecast, half-life | \(\sigma^2_{t+h\mid t} = \bar\sigma^2 + (\alpha+\beta)^{h-1}(\sigma^2_{t+1}-\bar\sigma^2)\), \(\ h_{1/2} = \frac{\ln 0.5}{\ln(\alpha+\beta)}\) |
| Kurtosis (normal \(\eta_t\)) | \(3[1-(\alpha+\beta)^2]/[1-(\alpha+\beta)^2-2\alpha^2]\) |
| Gaussian \(\ell_t\) | \(-\frac12\log\sigma_t^2 - (r_t-\mu_t)^2/(2\sigma_t^2)\) |
| MLE / QMLE | \(\mathcal N(0, I^{-1})\) / \(\mathcal N(0, J^{-1}IJ^{-1})\) |
| ARCH-LM | \(TR^2 \to \chi^2_q\) |
📋 Summary
- GARCH models the conditional variance; \(\varepsilon_t\) stays white noise but is not independent
- \(\alpha + \beta\) is the persistence; \(\alpha + \beta < 1\) gives a finite unconditional variance
- Random variance plus normal shocks gives fat tails: clustering and kurtosis are one fact
- Estimate by Gaussian (Q)MLE; under non-normal shocks keep the estimates and use Bollerslev–Wooldridge errors
- Test for ARCH with \(TR^2\); the boundary makes Wald and LR non-standard
- BEKK, CCC and DCC extend GARCH to many assets; jumps and SV add a second source of randomness
📚 Further Reading
- Engle (1982), Econometrica: ARCH and the LM test
- Bollerslev (1986), J. Econometrics: GARCH; Bollerslev & Wooldridge (1992), Econometric Reviews: QMLE
- Engle, Lilien & Robins (1987), Econometrica: ARCH-M
- Engle & Kroner (1995), Bollerslev (1990), Engle (2002): BEKK, CCC, DCC
- Hamilton (1994), ch. 21; Tsay (2010), ch. 3 and 10; Francq & Zakoïan (2019), GARCH Models
Next lecture: 16 · Structural Breaks and Parameter Stability
Time Series Econometrics — ARCH and GARCH